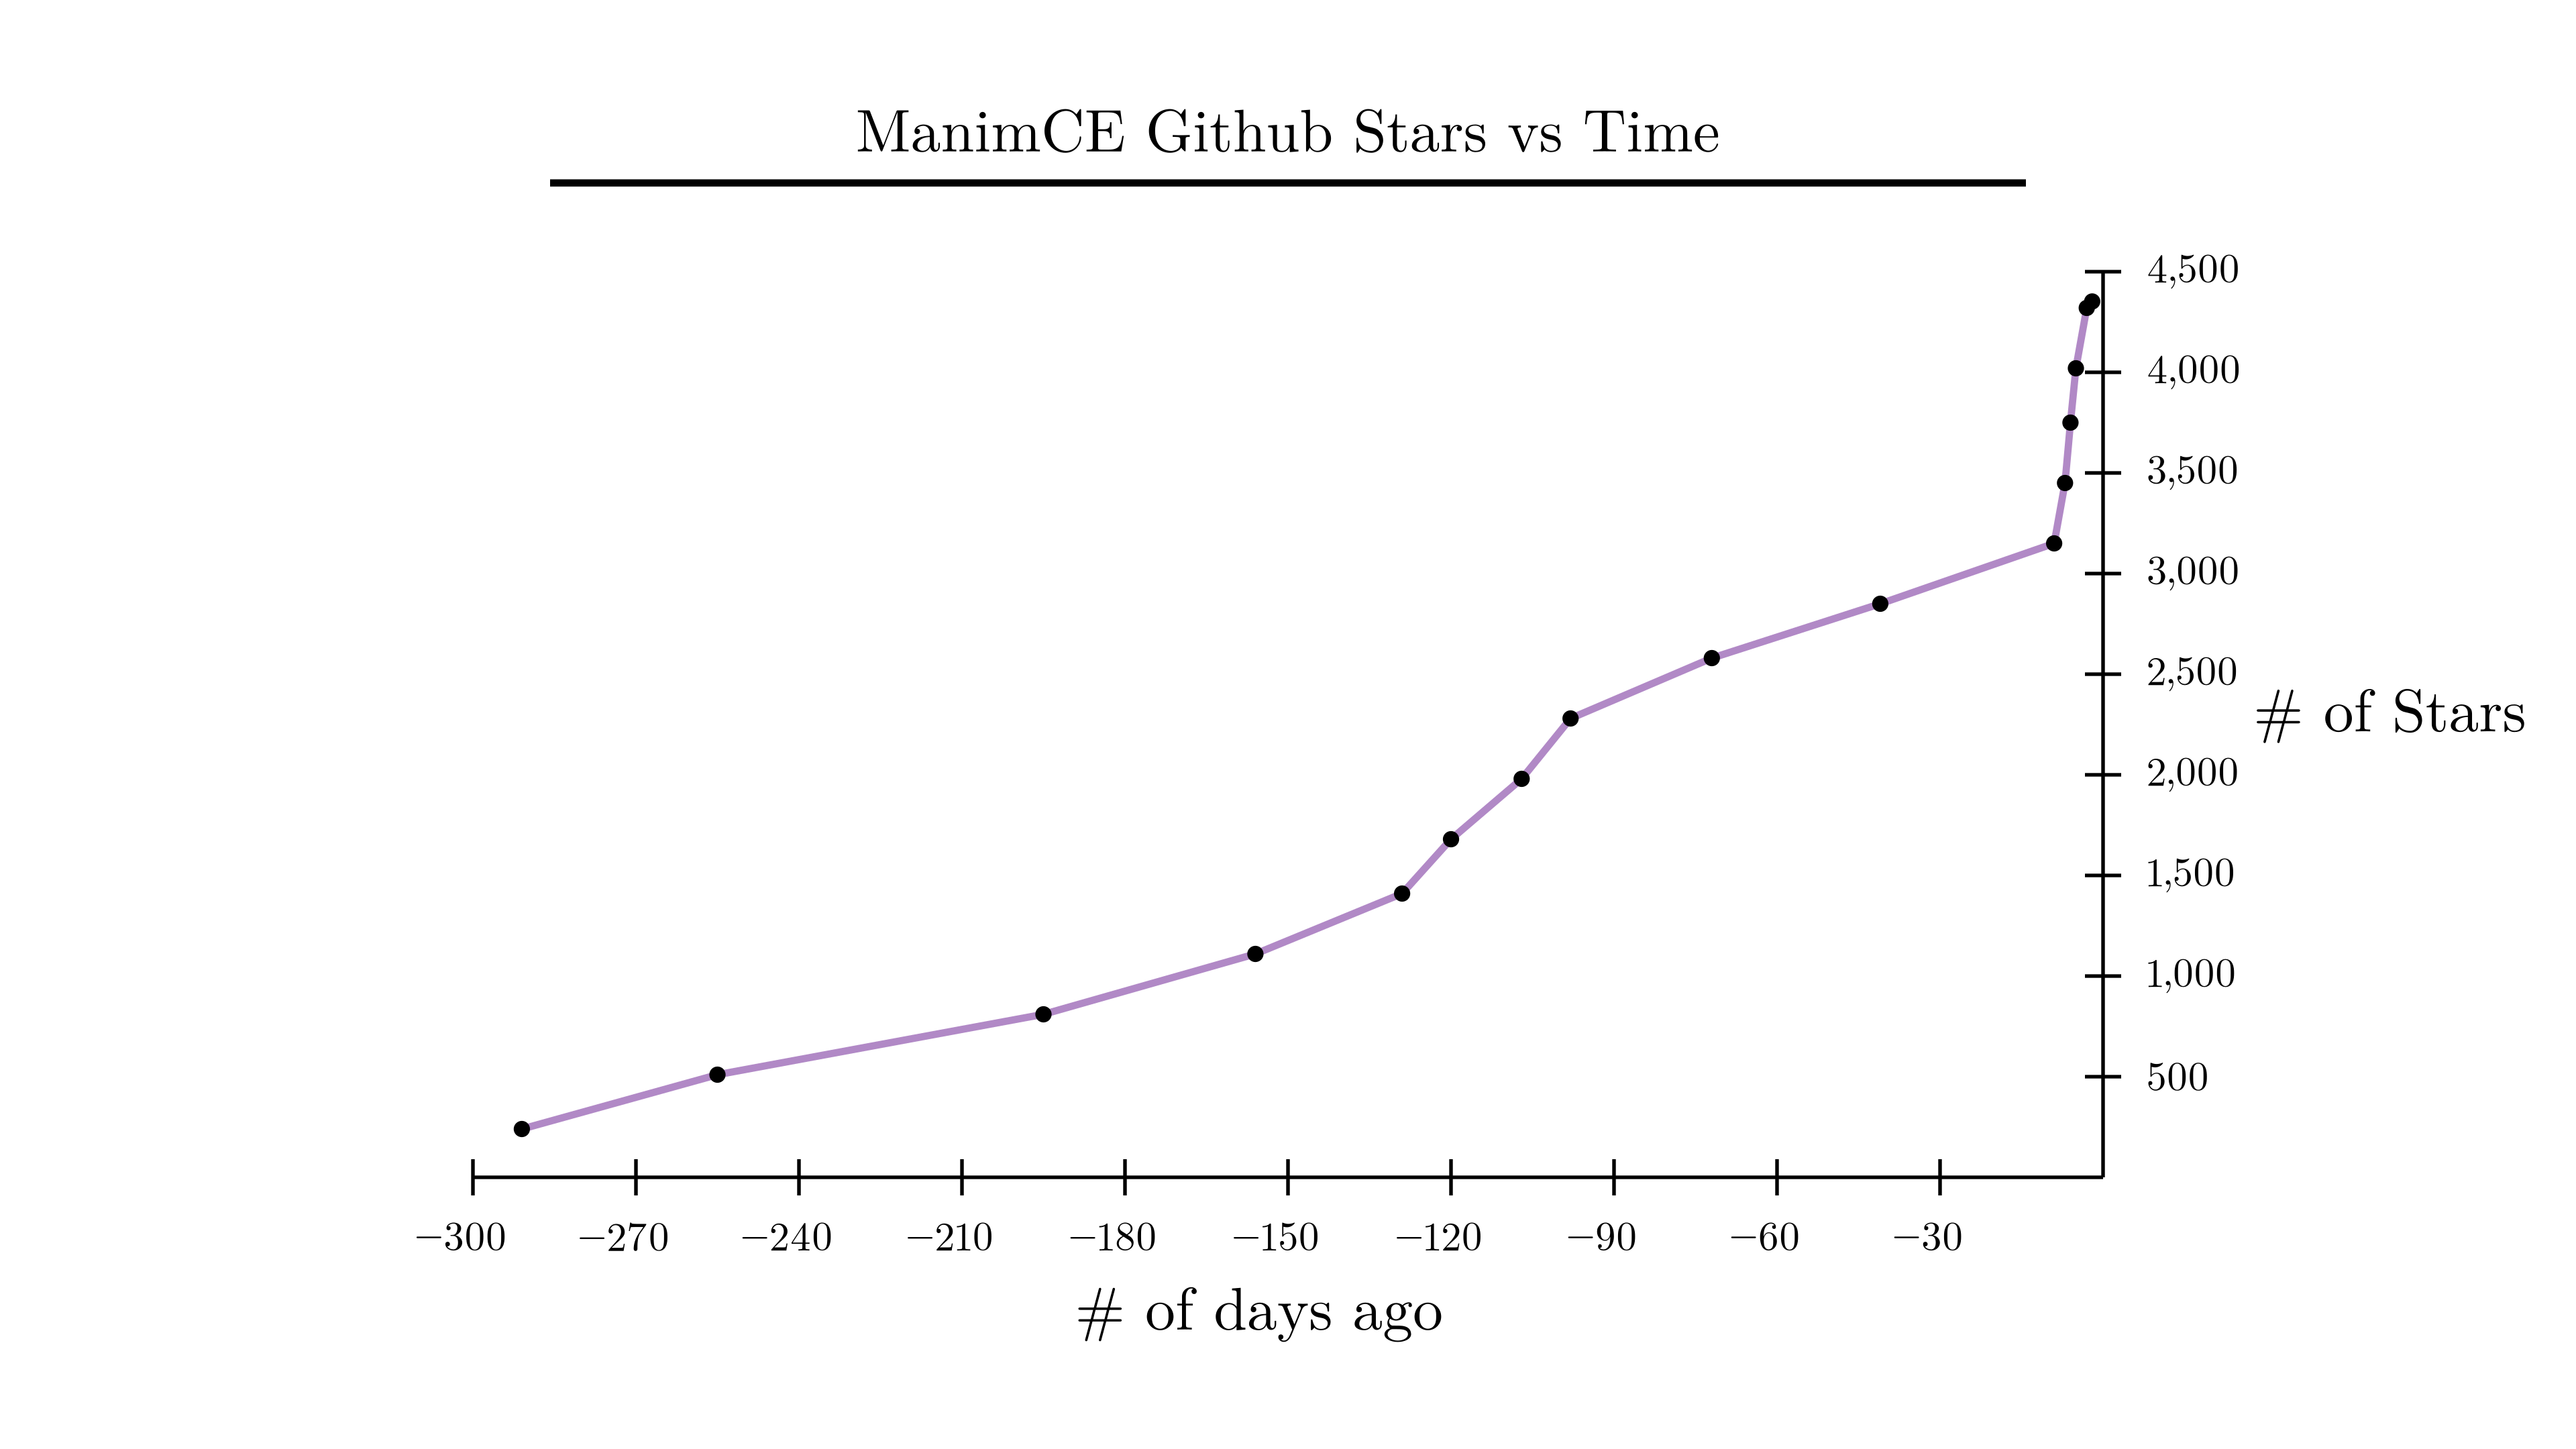
ManimCE stars over time
This graph really shows off what a shoutout can do for publicity 🌟🌟
config.background_color = WHITE

# thanks to https://star-history.t9t.io/ for the accessible data.
y_arr = [
    240,
    510,
    810,
    1110,
    1410,
    1680,
    1980,
    2280,
    2580,
    2850,
    3150,
    3450,
    3750,
    4020,
    4320,
    4352,
]

ha = [
    "Tue Oct 06 2020 20:00:00 GMT-0400 (Eastern Daylight Time)",
    "Wed Nov 11 2020 19:00:00 GMT-0500 (Eastern Standard Time)",
    "Sun Jan 10 2021 19:00:00 GMT-0500 (Eastern Standard Time)",
    "Thu Feb 18 2021 19:00:00 GMT-0500 (Eastern Standard Time)",
    "Wed Mar 17 2021 20:00:00 GMT-0400 (Eastern Daylight Time)",
    "Fri Mar 26 2021 20:00:00 GMT-0400 (Eastern Daylight Time)",
    "Thu Apr 08 2021 20:00:00 GMT-0400 (Eastern Daylight Time)",
    "Sat Apr 17 2021 20:00:00 GMT-0400 (Eastern Daylight Time)",
    "Thu May 13 2021 20:00:00 GMT-0400 (Eastern Daylight Time)",
    "Sun Jun 13 2021 20:00:00 GMT-0400 (Eastern Daylight Time)",
    "Thu Jul 15 2021 20:00:00 GMT-0400 (Eastern Daylight Time)",
    "Sat Jul 17 2021 20:00:00 GMT-0400 (Eastern Daylight Time)",
    "Sun Jul 18 2021 20:00:00 GMT-0400 (Eastern Daylight Time)",
    "Mon Jul 19 2021 20:00:00 GMT-0400 (Eastern Daylight Time)",
    "Wed Jul 21 2021 20:00:00 GMT-0400 (Eastern Daylight Time)",
    "Thu Jul 22 2021 20:00:00 GMT-0400 (Eastern Daylight Time)",
]


class data(Scene):
    def construct(self):

        # axes + labels
        ax = Axes(
            y_range=[0, 4500, 500],
            x_range=[-300, 0, 30],
            tips=False,
            x_length=9,
            y_length=5,
            axis_config={"number_scale_value": 0.45, "include_numbers": True},
            y_axis_config={"label_direction": RIGHT},
        ).set_color(BLACK)

        x_label = ax.get_x_axis_label(
            Tex(r"\# of days ago").scale(2 / 3), direction=DOWN * 2, edge=DOWN
        )
        y_labelz = ax.get_y_axis_label(
            Tex(r"\# of Stars").scale(2 / 3), direction=RIGHT, edge=RIGHT
        )
        y_label = Title("ManimCE Github Stars vs Time").scale(2 / 3)
        labels = VGroup(x_label, y_label, y_labelz).set_color(BLACK)

        from datetime import datetime

        dt_ha = np.array(
            [
                (datetime.strptime(time[4:15], "%b %d %Y") - datetime.now()).days
                for time in ha
            ]
        )

        gr = ax.get_line_graph(
            y_values=y_arr,
            x_values=dt_ha,
            vertex_dot_radius=0.045,
            vertex_dot_style={"color": BLACK},
            line_color=PURPLE_B,
        )
        self.add(ax, gr, labels)